Reporting & Performance Management
CRM for performance management
Monitor sales process
Track your sales team’s progress and performance with easy-to-access and accurate data insights.
Sales reports provide data-driven insights about the sales performance of individual reps and your entire team. This allows you to know if underperforming reps need coaching.
You can also identify who would benefit from regular one-on-one meetings to level up and hit their quotas. The same applies to your team. If your team isn’t hitting the company’s revenue goals, you can use sales reports to find gaps to improve your sales process.
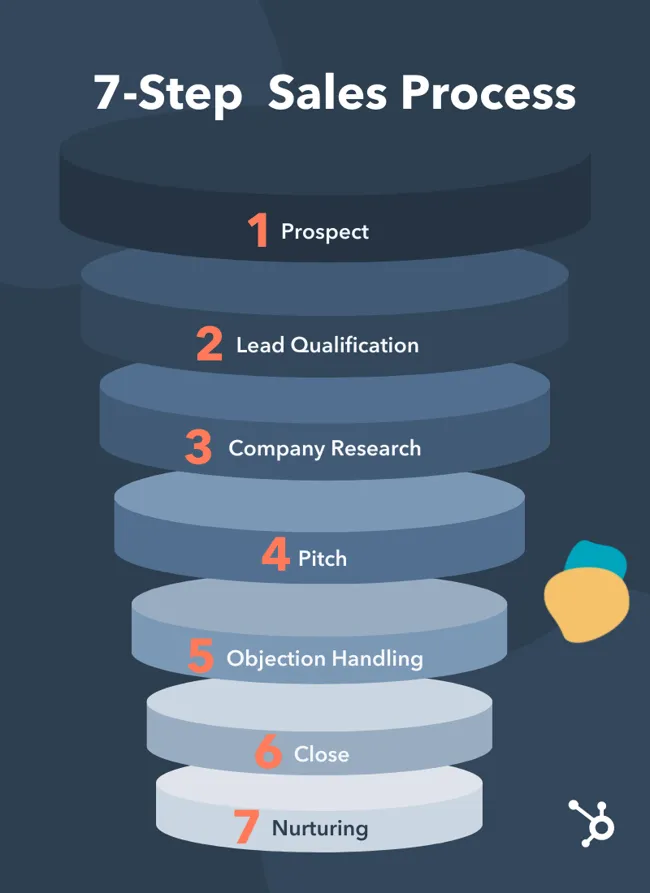

Monitor sales performance
Create daily sales reports and receive them on email or view them live on your team dashboard.
Monitoring and showing the sales performance of each team member motivates them to do more. Gamifying performance results can challenge other team members to quit settling for average performance. Put another way, sales reporting can create healthy competition and push your sales team to aim for the “best” outcomes."
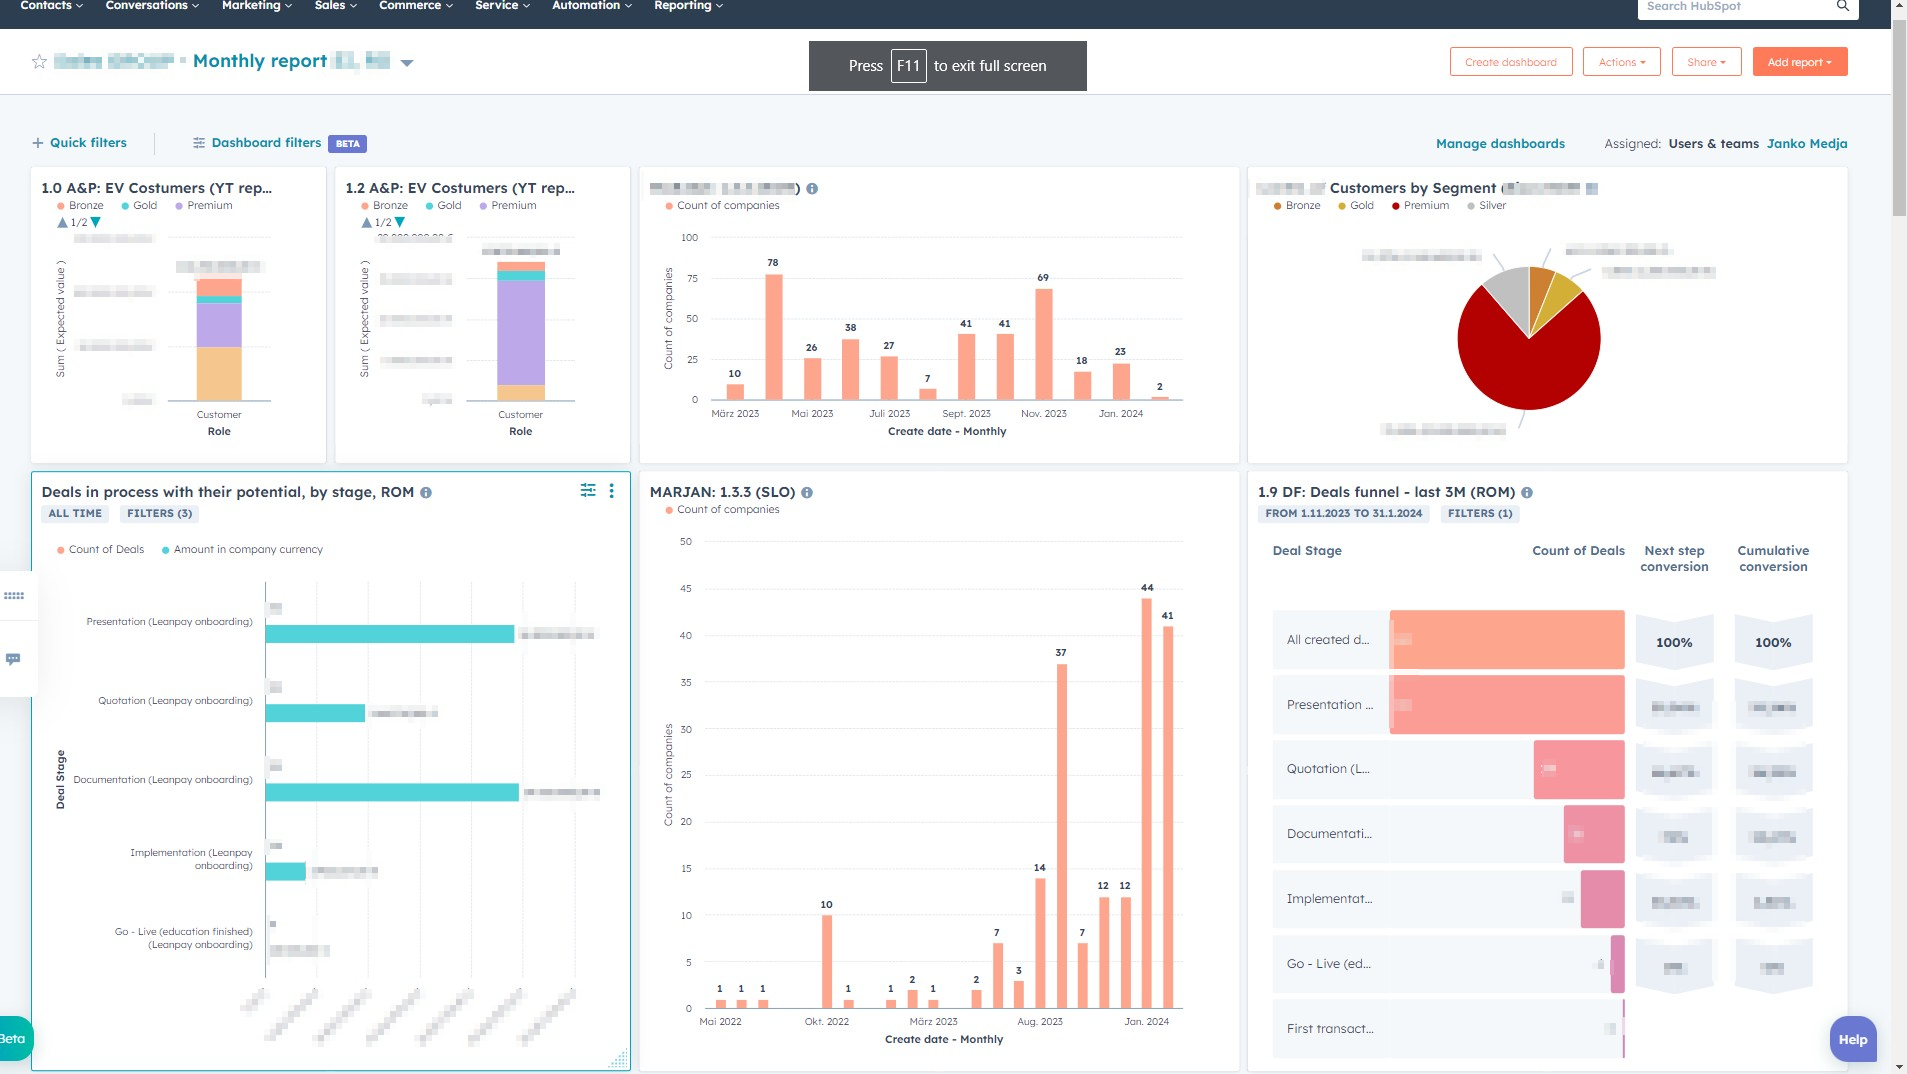
Management dashboards
With HubSpot's comprehensive reporting and dashboard system, users can easily generate visually appealing representations of crucial metrics tailored to their individual requirements. These management dashboards serve as invaluable tools for obtaining a top-level perspective on various facets of your business, empowering you to make informed decisions based on data-driven insights.
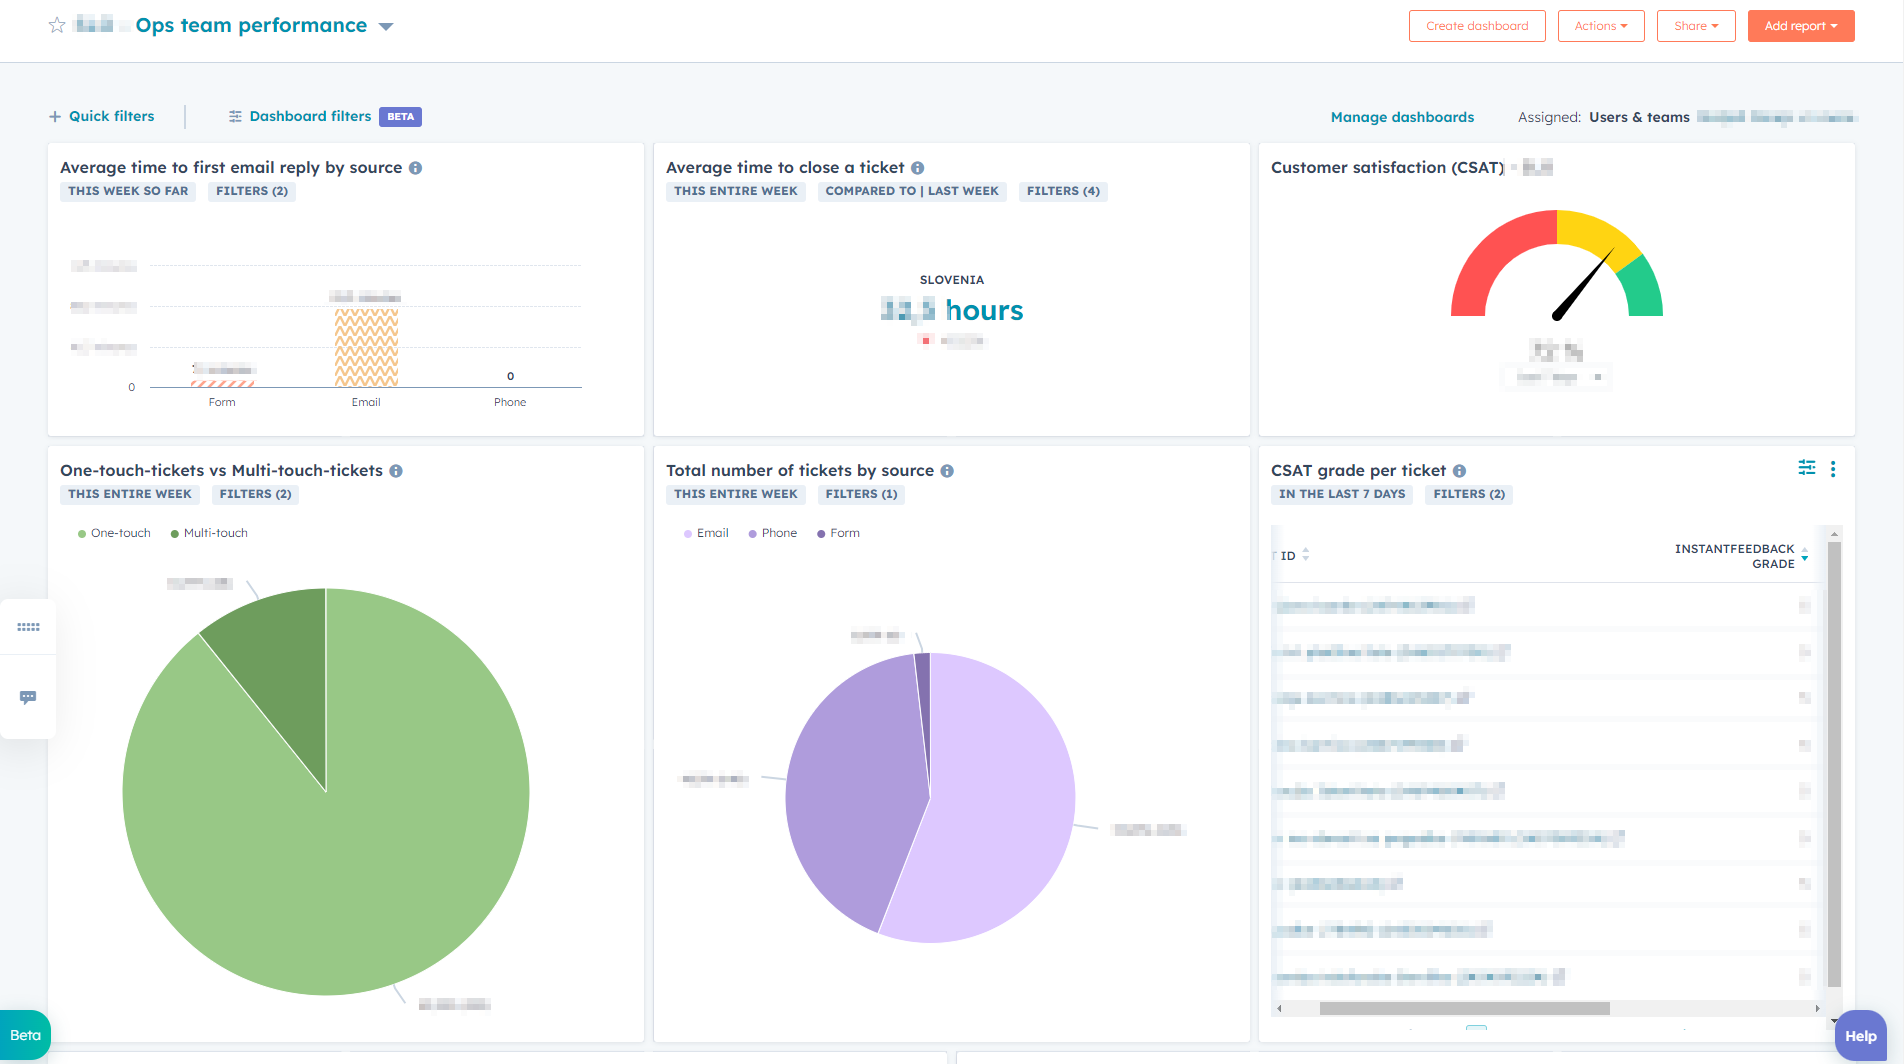
Support Team performance
Ticket Volume: Track the number of tickets submitted, resolved, and open over different timeframes (daily, weekly, monthly). This helps you understand the workload and identify peak periods.
Average Resolution Time: Monitor the average time it takes to resolve tickets, allowing you to identify areas for improvement in efficiency.
First Contact Resolution (FCR): Track the percentage of tickets resolved on the first interaction, indicating the effectiveness of your initial support response.
Customer Satisfaction (CSAT) Score: Monitor customer satisfaction with your support interactions through surveys or feedback forms.
Net Promoter Score (NPS): Measure customer loyalty and identify promoters and detractors to improve your overall support experience.
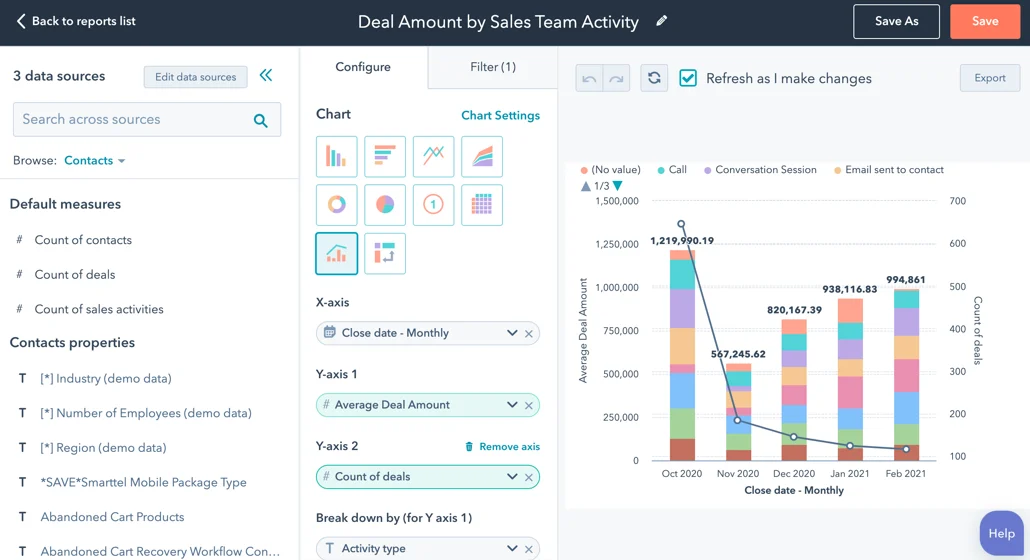
Easy-to-build custom reports
Where other tools leave you waiting for an admin or analyst to collect and analyze data, HubSpot’s reporting tools come out of the box, so there’s no delay and no fuss. Use the custom report builder to report on any single-object and cross-object data within your CRM. Easily visualize reports on anything that’s relevant to your unique business needs — from lead funnels to target account engagement and custom objects.
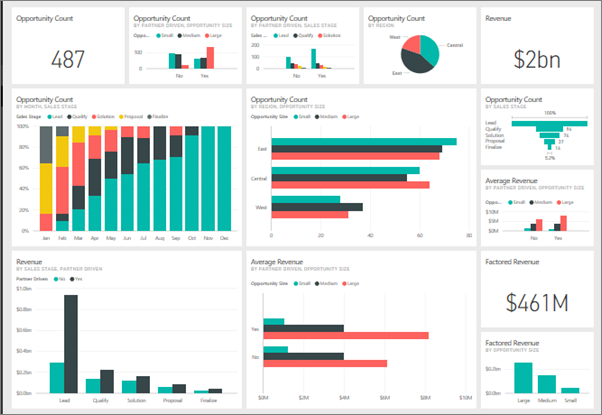
HubSpot Power BI Connector
HubSpot data can be queried and edited inside of Power BI, without affecting the integrity of the HubSpot database. You will have one easy-to-use dashboard that contains all of your company's key data.
Features:
- Visualize Your HubSpot Data Alongside Other Data
- Analyze Your HubSpot Data in Power BI
- SSL/TLS encryption at all times while data is “in transit” from HubSpot, so that your data remains secure.
- Compliant with GDPR regulations (Azure’s EU West data centers).
- Hubspot module: from 119€ to 500€ per month
- Implementation and integration with external datasets (ERP or similar): talk to sales
Contact us for free demo and presentation
Phone
+386 40 829 099
info@revvit.si
Address
Office: Bravničarjeva 13, Ljubljana
HQ: Matena, Ig, Slovenia
_MIN%20size.jpg?width=381&height=97&name=REVVIT_informatics_white%20BG%20(blue%2c%20black%20logo)_MIN%20size.jpg)